

Our Clients


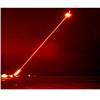
Directed Energy Weapons (DEW) - Market and Technology Forecast to 2034
Market forecast by Region, Domain, Type, Lifecycle phase, and Deployment. Country Analysis, Market and Technology Overview, Critical Raw Materials, Opportunity Analysis, and Leading Company Profiles
Publication date: January 2026 - Pages: 290

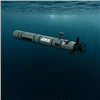
Unmanned Underwater Vehicles (UUV) for Defence and Security - Market and Technology Forecast to 2033
Market forecast by Region, Size, Operation Type, and Lifecycle Phase. Country Analysis, Market and Technology Overview, Critical Raw Materials, Opportunity Analysis, and Leading Company Profiles
Publication date: December 2025 - Pages: 270


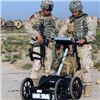
Military Unmanned Ground Vehicles (UGV) - Market and Technology Forecast to 2033
Market forecasts by Region, Application, Power Source, and Mode of Operation. Country Analysis, Market and Technology Overview, Opportunities Analysis, and Leading Company Profiles
Publication date: December 2025 - Pages: 262

Unmanned Surface Vehicles (USV) for Defence and Security - Market and Technology Forecast to 2033
Market forecast by Region, Hull Length, and Lifecycle Phase. Country Analysis, Market and Technology Overview, Critical Raw Materials, Opportunity Analysis, and Leading Company Profiles
Publication date: November 2025 - Pages: 191

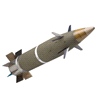
Precision Guided Munitions - Market and Technology Forecast to 2033
Market forecast by Regions, Calibre, Platform, and Product Format. Country Analysis, Market and Technology Overview, Critical Raw Materials, Opportunity Analysis, and Leading Company Profiles
Publication date: November 2025 - Pages: 211
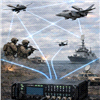
Electronic Warfare (EW) - Market and Technology Forecast to 2033
Market forecast by Regions, Platform, System, Integration, and Lifecycle Phase. Country Analysis, Market and Technology Overview, Critical Raw Materials, Opportunity Analysis, and Leading Company Profiles
Publication date: October 2025 - Pages: 311


Small Calibre Military Ammunition - Market and Technology Forecast to 2033
Market forecast by Region and Ammunition Calibre. Country Analysis, Market and Technology Overview including Critical Raw Materials, Opportunity Analysis, and Leading Company Profiles
Publication date: September 2025 - Pages: 150

Medium & Large Calibre Military Ammunition - Market and Technology Forecast to 2033
Market forecast by Region and Ammunition Calibre. Country Analysis, Market and Technology Overview including Critical Raw Materials, Opportunity Analysis, and Leading Company Profiles
Publication date: August 2025 - Pages: 174


Free-Space Optical Communication (FSOC) - Market and Technology Forecast to 2033
Market forecast by Region and Platform Type. Country Analysis, Market and Technology Overview including Critical Raw Materials, Opportunity Analysis, and Leading Company Profiles
Publication date: July 2025 - Pages: 146

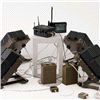
Counter-UAS (C-UAS) Systems - Market and Technology Forecast to 2033
Market forecast by Region, End-User, and Mitigation Type. Country Analysis, Market and Technology Overview including Critical Raw Materials, Opportunity Analysis, and Leading Company Profiles
Publication date: June 2025 - Pages: 174


Underwater Infrastructure Protection Systems - Market and Technology Forecast to 2033
Market forecast by Region, System, and Type. Country Analysis, Market and Technology Overview including Critical Raw Materials, Opportunity Analysis, and Leading Company Profiles
Publication date: May 2025 - Pages: 195

Surface Warships - Market and Technology Forecast to 2033
Market forecast by Region, Ship Type, and Operational Area. Country Analysis, Market and Technology Overview including Critical Raw Materials, Opportunities and Impact Analysis, and Leading Company Profiles
Publication date: May 2025 - Pages: 296


Sustainable Aviation Fuels (SAF) - Market and Technology Forecast to 2033
Market forecast by Region, Pathway, and Platform. Country Analysis, Market and Technology Overview including Supply Chains, Opportunities and Scenario Analysis, and Leading Company Profiles
Publication date: December 2024 - Pages: 173

Riflescopes - Market and Technology Forecast to 2032
Market forecast by Region, End-User, Magnification, and Technology. Country Analysis, Market and Technology Overview including Supply Chains and Critical Raw Materials, Opportunities and Scenario Analysis, and Leading Company Profiles
Publication date: December 2024 - Pages: 210

Photonic Components for Defence and Space Applications - Market and Technology Forecast to 2032
Market forecasts by Region, System, and End-User. Market and Technologies Overview, Critical Raw Materials, Country Analysis, Opportunity and Impact Analysis, and Leading Companies
Publication date: November 2024 - Pages: 188

New Powertrain Systems for Aircraft - Market and Technology Forecast to 2032
Market forecast by Region, Powertrain System, and End-User. Country Analysis, Market and Technology Overview including Supply Chains and Critical Raw Materials and Technologies, Opportunities and Impact Analysis, and Leading Company Profiles
Publication date: October 2024 - Pages: 210

High-density Interconnect PCB for Defence and Space Applications - Market and Technology Forecast to 2032
Market forecast by Region and Application. Market and Technologies Overview, Critical Raw Materials, Country Analysis, Opportunity and Impact Analysis, and Leading Companies
Publication date: August 2024 - Pages: 145

Firefighting Aircraft - Market and Technology Forecast to 2032
Market forecast by Region, Aircraft Type, and Fitment. Country Analysis, Market and Technology Overview including Supply Chains and Critical Raw Materials, Opportunities and Impact Analysis, and Leading Company Profiles
Publication date: July 2024 - Pages: 184
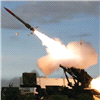
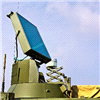
Ground Based Air Defence Systems - Market and Technology Forecast to 2032
Market forecast by Region, Component, and Range. Country Analysis, Market and Technology Overview including Supply Chains and Critical Raw Materials, Opportunities and Scenario Analysis, and Leading Company Profiles
Publication date: June 2024 - Pages: 212


Power Laser Sources for Defence and Space Applications - Market and Technology Forecast to 2032
Market forecast by Region, Segment, Power, Platform (Space & Defence), and Applications (Space & Defence). Country Analysis, Market and Technology Overview, Opportunities and Impact Analysis, and Leading Company Profiles
Publication date: May 2024 - Pages: 255


Cyber and Electromagnetic Activities (CEMA) - Market and Technology Forecast to 2032
Market forecasts by Technology , System Mobility, and Region. Country Analysis, Market and Technology Overview, Competitive Landscape,Opportunities and Impact Analysis, and Leading Company Profiles
Publication date: February 2024 - Pages: 134


Sustainable Energy Solutions for Military Mission Systems - Market and Technology Forecast to 2032
Market forecasts by Mission System, End-User, and Region. Country Analysis, Market and Technology Overview, Opportunities and Impact Analysis, and Leading Company Profiles
Publication date: December 2023 - Pages: 212

Commercial Aircraft Maintenance, Repair & Overhaul (MRO) - Market and Technology Forecast to 2032
Market forecasts by MRO Type, Platform, Organisation, and Region. Country Analysis, Market and Technology Overview, Opportunities and Impact Analysis, and Leading Company Profiles
Publication date: December 2023 - Pages: 255
Mortar Systems and Ammunition - Market and Technology Forecast to 2032
Market forecasts by Region, Mortar System Calibre, Mortar System Mobility, and Mortar Ammunition Calibre. Country Analysis, Market and Technology Overview, Impact and Opportunity Analysis, and Leading Company Profiles
Publication date: November 2023 - Pages: 143

Quantum Technology for Military Applications - Market and Technology Forecast to 2031
Market forecasts by Region, Technology, Application, and End-User. Market and Technology Overview, Country, Impact and Opportunity Analysis, and Leading Company Profiles
Publication date: September 2023 - Pages: 203


Military Aircraft Maintenance, Repair & Overhaul (MRO) - Market and Technology Forecast to 2031
Market forecasts by MRO Type, Platform and Region. Country Analysis, Market and Technology Overview, Opportunities and Impact Analysis, and Leading Company Profiles
Publication date: August 2023 - Pages: 151


Urban Air Mobility and Vertiports - Market and Technology Forecast to 2031
Market forecasts by Region, Vertiport Infrastructure, Service, and Platform. Country Analysis, Market and Technology Overview, Opportunities and Impact Analysis, and Leading Company Profiles
Publication date: May 2023 - Pages: 224
Chemical, Biological, Radiological & Nuclear (CBRN) Sensors - Market and Technology Forecast to 2031
Market forecasts by Region, Sensor type, Type, and by End-User. Country Analysis, Market and Technology Overview, Opportunities and Impact Analysis, and Leading Company Profiles
Publication date: April 2023 - Pages: 162

Military Command & Control Systems (C2) - Market and Technology Forecast to 2031
Market forecasts by Region, Platform, End-User, and System Element. Country Analysis, Market and Technology Overview, Opportunities and Impact Analysis, and Leading Company Profiles
Publication date: March 2023 - Pages: 167


Military Robots and Autonomous Systems - Market and Technology Forecast to 2030
Market forecasts by Region, by Technology, Application, Operation, Platforms, and by End-User. Technology and Market Overview, Events based Forecast, Opportunity Analysis, and Leading Companies Profiles
Publication date: December 2022 - Pages: 211

Soldier Modernisation - Market and Technology Forecast to 2030
Market forecasts by Region and by System with subsegments by: Vision System, Body Protection System, C3 System, Power System, and Weapons. Technology and Market Overview, Impact and Opportunity Analysis, and Leading Companies Profiles
Publication date: December 2022 - Pages: 190


Military Simulation and Virtual Training - Market and Technology Forecast to 2030
Market forecasts by Region, Component, Simulator, Type, Service, Software, Hardware, and by End-User. Market and Technology Overview, Market Dynamics, Impact and Opportunity Analysis, and Leading Companies
Publication date: August 2022 - Pages: 260


Batteries for Space and Aerospace - Market and Technology Forecast to 2030
Market forecasts by by Region, Value type, Sales type, Market, End-user, Application, Satellite type, Satellite orbit, Aircraft market, and by UAV market. Technology and Market Overview, Market and Impact Analysis, and Leading Companies
Publication date: May 2022 - Pages: 265


Aerospace and Defense Composites - Market and Technology Forecast to 2029
Market Forecasts By Region, Application, Manufacturing, Resin, and End-use. Trends, Market and Technology Overview, Key Users Overview, Country and Opportunity Analysis, and Leading Company Profiles.
Publication date: December 2021 - Pages: 198

Micro and Nano Air Vehicles for Defense and Security - Market and Technology Forecast to 2030
Market forecasts Micro and Nano UAV by Region, Technology, and End-Use. Market and Technology Overview, Country, Scenario and Opportunity Analysis, and Leading Company Profiles
Publication date: December 2021 - Pages: 213

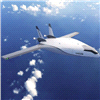
Airborne ISR Platforms & Payloads - Market and Technology Forecast to 2029
Market forecasts by Region, Technology, Platform, System, Payloads, Fuel-Type, Application, and by End-User. Technology and Market Overview, Opportunity Analysis, and Leading Companies
Publication date: November 2021 - Pages: 245


Global Edge Computing for Defense and Aerospace - Market and Technology Forecast to 2029
Market forecasts by Region, Technology, Component, Application, Platform, and End-User. Market Dynamics, Market and Technology Overview, Events based forecast, COVID-19 Analysis, and Leading Company Profiles
Publication date: April 2021 - Pages: 270

Global Commercial Air Traffic Management - Market and Technology Forecast to 2029
Market forecasts by Region, Airport Size, Offering, and hard/software. Country Analysis, Market Dynamics, Market and Technology Overview, Trends overview, Opportunity and COVID-19 Analysis, and Leading Company Profiles
Publication date: March 2021 - Pages: 232

Global Naval Sensors - Market and Technology Forecast to 2029
Market forecasts by Region, Platform, and Product. Country Analysis, Market Dynamics, Market and Technology Overview, Trends overview, Opportunity and COVID-19 Analysis, and Leading Company Profiles
Publication date: February 2021 - Pages: 320
Global Military Batteries - Market and Technology Forecast to 2029
Market forecasts by Region, Composition, and Application. Country Analysis, Market Dynamics, Market and Technology Overview, Trends overview, Opportunity and COVID-19 Analysis, and Leading Company Profiles
Publication date: January 2021 - Pages: 258

Global Hydrogen Aircraft - Market and Technology Forecast to 2029
Market forecasts by Region, Technology, Service, Platform, Range, Guidance System, and End-User. Market and Technology Overview, Opportunity and COVID-19 Analysis, and Leading Company Profiles
Publication date: December 2020 - Pages: 374


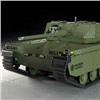
Global Military Land Vehicle Electronics (Vetronics) - Market and Technology Forecast to 2028
Market forecasts by Region, Vehicle, and System. Current Market and Technology Overview, Country and Opportunity Analysis, COVID-19 analysis, and Leading Company Profiles
Publication date: October 2020 - Pages: 280

Global Additive Manufacturing in Defense and Aerospace - Market and Technology Forecast to 2028
Market forecasts by Region, Technology, and by End-User. Current Market, Trends, Technology Overview, Country and Opportunity Analysis, and Leading Company Profiles
Publication date: July 2020 - Pages: 207

Global Military IoT & Sensors - Market and Technology Forecast to 2028
COVID-19 included Market forecasts by Region, Platform, Type, Technology, Component, and Deployment. Country and Opportunity Analysis, Market Overview and Trends, and Leading Company Profiles
Publication date: June 2020 - Pages: 316