Global UAVs for First Responders Market Forecast to 2021
Global UAVs for First Responders Market Forecast to 2021
Unmanned Aerial Vehicles for First Responders: Global Market & Technology Forecast, Buying Guide and Operating Concept
Unmanned Aerial Vehicles for First Responders: Global Market & Technology Forecast, Buying Guide and Operating Concept
The global Unmanned Aerial Vehicles (UAVs) for First Responders Market is valued at US$ 487.6 million in 2016 and is projected to grow at a CAGR of 7.3% to US$ 693.2 million in 2025 with a cumulative market volume of US$ 3,649 million.
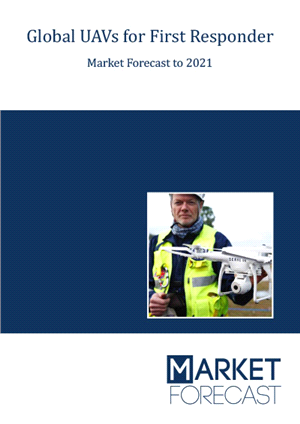
First Responder UAVs Are Finally Getting Serious. Law enforcers and other First Responders have a very poor track record with ‘drones’ or Unmanned Aerial Vehicles (UAVs).
With so much hype and promise, why have UAVs for First Responders worked out so poorly?
One fundamental reason is that First Responders believed the sales hype and bought whatever toy, radio controlled, hobby drone the industry would paint in their colors. Two thousand dollar RC helicopters became $150,000 ‘systems’. Quad, hex and octo rotors became the flavors of the day. Then reality arrived in the form of weather, darkness, airspace rules and a pair of officers sidelined to struggle with each toy.
The airspace bureaucracy is very slow: The FAA is not sure how to deal with this new phenomenon (other than to try to restrict their operation as much as possible). Almost daily news of civilian quadcopters flying illegally near commercial airlines, interfering with firefighting efforts and invading privacy harm First Responder efforts to do it right.
This is why Market Forecast created an all-you-need-to-know UAVs for First Responders report – a single publication that combines a Market and Technology Forecast with an Operating Concept and a Buying Guide.
- System designers, vendors, policy makers and operators will benefit from the comprehensive markets and technologies analysis.
- First Responders need the Buying Guide to avoid the very costly mistakes some of their predecessors made, plus the terminal mistake of copying military methods.
- Both groups need the detailed Operating Concept because, without a proper Operating Concept, there is no way to successfully procure, integrate, train for and operate this new generation of autonomous aircraft.
Specifically, this report provides the following advantages:
- Timely Business Opportunities – specific details on what First Responders need and how to sell to them in a way that generates profitable word of mouth sales.
- Reasoned Market Forecasts – fact-based, scenario-driven tables and charts over multiple technologies and regions.
- Reasoned Technology Forecasts – only the relevant systems with clear explanations of the differences with the UAVs seen in todays press.
- Education – both First Responders and sellers will learn the best ways to develop these new capabilities while avoiding the political problems.
- Detailed Drivers and Inhibitors – what will help the markets and what will hurt them.
Related studies:
- Global Military UAVs - Market and Technology Forecast to 2027
- Global Counter-UAV (C-UAV) Systems - Market and Technology Forecast to 2028
- Global Unmanned Aerial Vehicles (UAV) for Border Security Market and Technologies Forecast to 2025
- Global Stratospheric UAV Payloads Technology and Market Forecast to 2025
- 1. Introduction
- 1.1. Scope
- 1.2. What are First Responders?
- 1.3. What are UAVs?
- 1.4. Forecast Scenarios
- 1.4.1. Why Scenarios?
- 1.4.2. Scenario I: Little or No Access to Civilian Airspace
- 1.4.3. Scenario II: Easy Access to Civilian Airspace
- 1.4.4. Scenario Notes
- 1.5. Research Team and Methods
- 1.6. Who Will Benefit from this Forecast?
- 1.6.1. Vendors
- 1.6.2. First Responders
- 1.6.3. Policy Makers & Analysts
- 1.6.4. Procurement Managers
- 1.7. Language, Disclaimer and Further Information
- 1.8. How to Extract High Quality Graphics
- 2. Executive Summary
- 2.1. What are UAVs for First Responders?
- 2.1.1. Who will these UAVs Help?
- 2.2. UAV Acceptance
- 2.2.1. Privacy Issues
- 2.2.2. Jobs
- 2.3. UAV Markets
- 2.3.1. UAV Buying Guide
- 2.4. Major Findings
- 2.5. Major Conclusions
- 2.6. Important Tables and Graphs
- 2.6.1. UAVs for First Responders Market Forecast by Region – 2016-2021
- 2.6.2. UAVs for First Responders Market Forecast by Technology – 2016-2021
- 2.6.3. UAVs for First Responders – Procurement Forecast by Technology – 2016-2021
- 2.6.4. UAVs for First Responders – Operation and Maintenance Market Forecast by Technology – 2016-2021
- 2.6.5. UAVs for First Responders – Scenario I vs. Scenario II Market Forecast Comparison – 2016-2021
- 3. Current UAV Technologies
- 3.1. UAV Manufacturing Nations
- 3.1.1. Opportunity Alert
- 3.2. Stratospheric UAVs
- 3.2.1. Opportunity Alert
- 3.3. Jet Stream UAVs
- 3.4. High Altitude UAVs
- 3.5. Medium Altitude UAVs
- 3.6. Low Altitude UAVs
- 3.6.1. Remotely Controlled (RC) Aircraft
- 3.7. Micro UAVs
- 3.7.1. Opportunity Alert
- 3.8. Nano UAVs
- 3.9. Aerostats
- 3.10. Electric Fuel Cells
- 3.10.1. Opportunity Alert
- 4. Operating Concept
- 4.1. Planning Considerations
- 4.1.1. Safe Operations
- 4.1.2. Geographic Situation
- 4.1.3. Political Situation
- 4.1.4. Realistic Situation
- 4.1.5. Limit Ambitions
- 4.2. Sample Operating Concept
- 4.2.1. Minimum Capabilities
- 4.2.2. Step-by-Step Operating Concept
- 4.2.3. Operating Concept Illustrations
- 5. Buying Guide
- 5.1. Requirements List
- 5.1.1. Maximum Allowable Flying Time
- 5.1.2. Weather
- 5.1.3. Airspeed
- 5.1.4. UAV Operator Capabilities
- 5.1.5. Lessons to Learn
- 5.2. UAV Base Site Selection
- 5.2.1. Automation
- 5.2.2. Vehicles
- 5.3. Storage and Launch Systems
- 5.3.1. Recommendation
- 5.4. The Bottom Line
- 5.4.1. UAVs are Strange and Scary.
- 5.4.2. With an Aviation Unit
- 5.4.3. Without an Aviation Unit
- 5.4.4. Validate Seller Claims
- 5.4.5. Learn from Early UAV Adopters
- 6. Drivers & Inhibitors
- 6.1. Drivers (The Good News)
- 6.1.1. Military UAV Successes
- 6.1.2. Aircraft Expense
- 6.1.3. Technology is Here and Improving
- 6.1.4. Will Certainly Save Lives
- 6.1.5. Commercial Pressure to Open Airspace
- 6.1.6. Early Success will Improve Public Acceptance
- 6.1.7. Domestic Production
- 6.1.8. American UAV Test Sites
- 6.2. Inhibitors (The Bad News)
- 6.2.1. Airspace Regulators
- 6.2.2. American Airspace Regulators Ignoring First Responders
- 6.2.3. Government Lies & Invasions of Privacy
- 6.2.4. Public Fears “Drones”
- 6.2.5. Vendors Over-Promise and Under-Deliver
- 6.2.6. Airspace Integration is Very, Very Difficult
- 6.2.7. Nobody Wants to be First
- 7. Introduction to Forecasts
- 7.1. Basic Assumptions
- 7.1.1. Scenario I
- 7.1.2. Scenario II
- 7.2. Micro UAVs for Urban Areas
- 7.2.1. Scenario I Forecast
- 7.2.2. Scenario II Forecast
- 7.2.3. Technology Upside
- 7.2.4. Reality Check (downside)
- 7.3. Low Altitude UAVs for Open Spaces
- 7.3.1. Scenario I Forecast
- 7.3.2. Scenario II Forecast
- 7.3.3. Technology Upside
- 7.3.4. Reality Check (downside)
- 8. UAVs for First Responders – Market Forecast by Regions – 2016-2021
- 8.1. Scenario I – UAVs for First Responders Market Forecast by Region – 2016-2021
- 8.1.1. Africa – Scenario I UAVs for First Responders – Market Forecast by Technology – 2016-2021
- 8.1.2. Central Asia – Scenario I UAVs for First Responders – Market Forecast by Technology – 2016-2021
- 8.1.3. Europe – Scenario I UAVs for First Responders – Market Forecast by Technology – 2016-2021
- 8.1.4. Near East – Scenario I UAVs for First Responders – Market Forecast by Technology – 2016-2021
- 8.1.5. North America – Scenario I UAVs for First Responders – Market Forecast by Technology – 2016-2021
- 8.1.6. South America – Scenario I UAVs for First Responders – Market Forecast by Technology – 2016-2021
- 8.1.7. East Asia & Oceania – Scenario I UAVs for First Responders – Market Forecast by Technology – 2016-2021
- 8.2. Scenario II – UAVs for First Responders Market Forecast by Region – 2016-2021
- 8.2.1. Africa – Scenario II UAVs for First Responders – Market Forecast by Technology – 2016-2021
- 8.2.2. Central Asia – Scenario II UAVs for First Responders – Market Forecast by Technology – 2016-2021
- 8.2.3. Europe – Scenario II UAVs for First Responders – Market Forecast by Technology – 2016-2021
- 8.2.4. Near East – Scenario II UAVs for First Responders – Market Forecast by Technology – 2016-2021
- 8.2.5. North America – Scenario II UAVs for First Responders – Market Forecast by Technology – 2016-2021
- 8.2.6. South America – Scenario II UAVs for First Responders – Market Forecast by Technology – 2016-2021
- 8.2.7. East Asia & Oceania – Scenario II UAVs for First Responders – Market Forecast by Technology – 2016-2021
- 9. UAVs for First Responders – Market Forecast by Technology – 2016-2021
- 9.1. Scenario I – UAVs for First Responders Market Forecast by Technology – 2016-2021
- 9.1.1. Micro UAVs for First Responders – Scenario I Market Forecast by Region – 2016-2021
- 9.1.2. Low Altitude UAVs for First Responders – Scenario I Market Forecast by Region – 2016-2021
- 9.1.3. Medium Altitude UAVs for First Responders – Scenario I Market Forecast by Region – 2016-2021
- 9.1.4. High Altitude UAVs for First Responders – Scenario I Market Forecast by Region – 2016-2021
- 9.2. Scenario II – UAVs for First Responders Market Forecast by Technology – 2016-2021
- 9.2.1. Micro UAVs for First Responders – Scenario II Market Forecast by Region – 2016-2021
- 9.2.2. Low Altitude UAVs for First Responders – Scenario II Market Forecast by Region – 2016-2021
- 9.2.3. Medium Altitude UAVs for First Responders – Scenario II Market Forecast by Region – 2016-2021
- 9.2.4. High Altitude UAVs for First Responders – Scenario II Market Forecast by Region – 2016-2021
- 10. UAVs for First Responders – Procurement Forecast by Technology – 2016-2021
- 10.1. Scenario I – UAVs for First Responders – Global Procurement Forecast by Technology – 2016-2021
- 10.2. Scenario II – UAVs for First Responders – Global Procurement Forecast by Technology – 2016-2021
- 11. UAVs for First Responders Procurement Forecast by Region – 2016-2021
- 11.1. Scenario I – UAVs for First Responders Procurement Forecast by Region – 2016-2021
- 11.2. Scenario II – UAVs for First Responders Procurement Forecast by Region – 2016-2021
- 12. UAVs for First Responders – Operation and Maintenance Market Forecast by Technology – 2016-2021
- 12.1. Scenario I – UAVs for First Responders – Global Operation and Maintenance Market Forecast by Technology – 2016-2021
- 12.2. Scenario II – UAVs for First Responders – Global Operation and Maintenance Market Forecast by Technology – 2016-2021
- 13. UAVs for First Responders – Operations and Maintenance Market Forecast by Region – 2016-2021
- 13.1. Scenario I – UAVs for First Responders Operations and Maintenance Market Forecast by Region – 2016-2021
- 13.2. Scenario II – UAVs for First Responders Operations and Maintenance Market Forecast by Region – 2016-2021
- 14. UAVs for First Responders – Scenario I vs. Scenario II Market Forecast Comparison – 2016-2021
- 14.1. UAVs for First Responders – Scenario I vs. Scenario II Market Forecast Comparison by Technology – 2016-2021
- 14.1.1. Micro UAVs for First Responders – Scenario I vs. Scenario II Market Forecast
- 14.1.2. Low Altitude UAVs for First Responders – Scenario I vs. Scenario II Market Forecast Comparison – 2016-2021
- 14.1.3. Medium Altitude UAVs for First Responders- Scenario I vs. Scenario II Market Forecast Comparison – 2016-2021
- 14.1.4. High Altitude UAVs for First Responders – Scenario I vs. Scenario II Market Forecast Comparison – 2016-2021
- 14.2. UAVs for First Responders – Scenario I vs. Scenario II Procurement Forecast Comparison by Technology – 2016-2021
- 14.2.1. Micro UAVs for First Responders – Scenario I vs. Scenario II Procurement Forecast Comparison – 2016-2021
- 14.2.2. Low Altitude UAVs for First Responders – Scenario I vs. Scenario II Procurement Forecast Comparison – 2016-2021
- 14.2.3. Medium Altitude UAVs for First Responders- Scenario I vs. Scenario II Procurement Forecast Comparison – 2016-2021
- 14.2.4. High Altitude UAVs for First Responders – Scenario I vs. Scenario II Procurement Forecast Comparison – 2016-2021
- 14.3. UAVs for First Responders – Scenario I vs. Scenario II Operation and Maintenance Market Forecast Comparison by Technology – 2016-2021
- 14.3.1. Micro UAVs for First Responders – Scenario I vs. Scenario II Operation and Maintenance Market Forecast Comparison – 2016-2021
- 14.3.2. Low Altitude UAVs for First Responders – Scenario I vs. Scenario II Operation and Maintenance Market Forecast Comparison – 2016-2021
- 14.3.3. Medium Altitude UAVs for First Responders- Scenario I vs. Scenario II Operation and Maintenance Market Forecast Comparison – 2016-2021
- 14.3.4. High Altitude UAVs for First Responders – Scenario I vs. Scenario II Operation and Maintenance Market Forecast Comparison – 2016-2021
- 14.4. UAVs for First Responders – Scenario I vs. Scenario II Market Forecast Comparison by Region – 2016-2021
- 14.4.1. Africa – UAVs for First Responders – Scenario I vs. Scenario II Market Forecast Comparison – 2016-2021
- 14.4.2. Central Asia – UAVs for First Responders – Scenario I vs. Scenario II Market Forecast Comparison – 2016-2021
- 14.4.3. Europe – UAVs for First Responders – Scenario I vs. Scenario II Market Forecast Comparison – 2016-2021
- 14.4.4. Near East – UAVs for First Responders – Scenario I vs. Scenario II Market Forecast Comparison – 2016-2021
- 14.4.5. North America – UAVs for First Responders – Scenario I vs. Scenario II Market Forecast Comparison – 2016-2021
- 14.4.6. South America – UAVs for First Responders – Scenario I vs. Scenario II Market Forecast Comparison – 2016-2021
- 14.4.7. East Asia & Oceania – UAVs for First Responders – Scenario I vs. Scenario II Market Forecast Comparison – 2016-2021
- 15. Business Opportunities
- 15.1. Opportunity 1
- 15.2. Opportunity 2
- 15.3. Opportunity 3
- 15.4. Opportunity 4
- 15.5. Opportunity 5
- 15.6. Opportunity 6
- 15.7. Opportunity 7
- 15.8. Opportunity 8
- 15.9. Opportunity 9
- 15.10. Opportunity 10
- 15.11. Opportunity 11
- 15.12. Opportunity 12
- 15.13. Opportunity 13
- 15.14. Opportunity 14
- 15.15. Opportunity 15
Table 1 – Number of Commercial UAV Operators
Table 2 – Scenario I – UAVs for First Responders Market Forecast by Region by [$Millions] – 2016-2021
Table 3 – Scenario II – UAVs for First Responders Market Forecast by Region by [$Millions] – 2016-2021
Table 4 – Scenario I UAVs for First Responders – Global Market Forecast by Technology by [$Millions] – 2016-2021
Table 5 – Scenario II UAVs for First Responders – Global Market Forecast by Technology by [$Millions] – 2016-2021
Table 6 – Scenario I UAVs for First Responders – Global Procurement Forecast by Technology by [$Millions] – 2016-2021
Table 7 – Scenario II UAVs for First Responders – Global Procurement Forecast by Technology by [$Millions] – 2016-2021
Table 8 – Scenario I UAVs for First Responders – Global O&M Market Forecast by Technology by [$Millions] – 2016-2021
Table 9 – Scenario II UAVs for First Responders – Global O&M Market Forecast by Technology by [$Millions] – 2016-2021
Table 10 – UAVs for First Responders – Scenario I vs. Scenario II Global Market Forecast Comparison by [$Millions] – 2016-2021
Table 11 – Joint UAV Group Classification (JCOE CONOPS)
Table 12 – Scenario I – UAVs for First Responders Market Forecast by Region by [$Millions] – 2016-2021
Table 13 – Scenario I – UAVs for First Responders Market Forecast Share by Region by [%] – 2016-2021
Table 14 – Africa – Scenario I UAVs for First Responders – Market Forecast by Technology by [$Millions] – 2016-2021
Table 15 – Africa – Scenario I UAVs for First Responders – Market Forecast Share by Technology by [%] – 2016-2021
Table 16 – Africa – Scenario I UAVs for First Responders – Procurement Forecast by Technology by [$Millions] – 2016-2021
Table 17 – Africa – Scenario I UAVs for First Responders – Procurement Forecast Share by Technology by [%] – 2016-2021
Table 18 – Africa – Scenario I UAVs for First Responders – O&M Market Forecast by Technology by [$Millions] – 2016-2021
Table 19 – Africa – Scenario I UAVs for First Responders – O&M Market Forecast Share by Technology by [%] – 2016-2021
Table 20 – Central Asia – Scenario I UAVs for First Responders – Market Forecast by Technology by [$Millions] – 2016-2021
Table 21 – Central Asia – Scenario I UAVs for First Responders – Market Forecast Share by Technology by [%] – 2016-2021
Table 22 – Central Asia – Scenario I UAVs for First Responders – Procurement Forecast by Technology by [$Millions] – 2016-2021
Table 23 – Central Asia – Scenario I UAVs for First Responders – Procurement Forecast Share by Technology by [%] – 2016-2021
Table 24 – Central Asia – Scenario I UAVs for First Responders – O&M Market Forecast by Technology by [$Millions] – 2016-2021
Table 25 – Central Asia – Scenario I UAVs for First Responders – O&M Market Forecast Share by Technology by [%] – 2016-2021
Table 26 – Europe – Scenario I UAVs for First Responders – Market Forecast by Technology by [$Millions] – 2016-2021
Table 27 – Europe – Scenario I UAVs for First Responders – Market Forecast Share by Technology by [%] – 2016-2021
Table 28 – Europe – Scenario I UAVs for First Responders – Procurement Forecast by Technology by [$Millions] – 2016-2021
Table 29 – Europe – Scenario I UAVs for First Responders – O&M Market Forecast by Technology by [$Millions] – 2016-2021
Table 30 – Europe – Scenario I UAVs for First Responders – O&M Market Forecast Share by Technology by [%] – 2016-2021
Table 31 – Near East – Scenario I UAVs for First Responders – Market Forecast by Technology by [$Millions] – 2016-2021
Table 32 – Near East – Scenario I UAVs for First Responders – Procurement Forecast by Technology by [$Millions] – 2016-2021
Table 33 – Near East – Scenario I UAVs for First Responders – O&M Market Forecast by Technology by [$Millions] – 2016-2021
Table 34 – Near East – Scenario I UAVs for First Responders – O&M Market Forecast Share by Technology by [%] – 2016-2021
Table 35 – North America – Scenario I Micro UAVs for First Responders – Market Forecast by Market Segments by [$Millions] – 2016-2021
Table 36 – North America – Scenario I UAVs for First Responders – Market Forecast Share by Market Segments by [%] – 2016-2021
Table 37 – South America – Scenario I UAVs for First Responders – Market Forecast by Technology by [$Millions] – 2016-2021
Table 38 – South America – Scenario I UAVs for First Responders – Market Forecast Share by Technology by [%] – 2016-2021
Table 39 – South America – Scenario I UAVs for First Responders – Procurement Forecast by Technology by [$Millions] – 2016-2021
Table 40 – South America – Scenario I UAVs for First Responders – Procurement Forecast Share by Technology by [%] – 2016-2021
Table 41 – South America – Scenario I UAVs for First Responders – O&M Market Forecast by Technology by [$Millions] – 2016-2021
Table 42 – South America – Scenario I UAVs for First Responders – O&M Market Forecast Share by Technology by [%] – 2016-2021
Table 43 – East Asia and Oceania – Scenario I UAVs for First Responders – Market Forecast by Technology by [$Millions] – 2016-2021
Table 44 – East Asia and Oceania – Scenario I UAVs for First Responders – Market Forecast Share by Technology by [%] – 2016-2021
Table 45 – East Asia and Oceania – Scenario I UAVs for First Responders – Procurement Forecast by Technology by [$Millions] – 2016-2021
Table 46 – East Asia and Oceania – Scenario I UAVs for First Responders – Procurement Forecast Share by Technology by [%] – 2016-2021
Table 47 – East Asia and Oceania – Scenario I UAVs for First Responders – O&M Market Forecast by Technology by [$Millions] – 2016-2021
Table 48 – East Asia and Oceania – Scenario I UAVs for First Responders – O&M Market Forecast Share by Technology by [%] – 2016-2021
Table 49 – Scenario II – UAVs for First Responders Market Forecast by Region by [$Millions] – 2016-2021
Table 50 – Scenario II – UAVs for First Responders Market Forecast Share by Region by [%] – 2016-2021
Table 51 – Africa – Scenario II UAVs for First Responders – Market Forecast by Technology by [$Millions] – 2016-2021
Table 52 – Africa – Scenario II UAVs for First Responders – Market Forecast Share by Technology by [%] – 2016-2021
Table 53 – Africa – Scenario II UAVs for First Responders – Procurement Forecast by Technology by [$Millions] – 2016-2021
Table 54 – Africa – Scenario II UAVs for First Responders – Procurement Forecast Share by Technology by [%] – 2016-2021
Table 55 – Africa – Scenario II UAVs for First Responders – O&M Market Forecast by Technology by [$Millions] – 2016-2021
Table 56 – Africa – Scenario II UAVs for First Responders – O&M Market Forecast Share by Technology by [%] – 2016-2021
Table 57 – Central Asia – Scenario II UAVs for First Responders – Market Forecast by Technology by [$Millions] – 2016-2021
Table 58 – Central Asia – Scenario II UAVs for First Responders – Market Forecast Share by Technology by [%] – 2016-2021
Table 59 – Central Asia – Scenario II UAVs for First Responders – Procurement Forecast by Technology by [$Millions] – 2016-2021
Table 60 – Central Asia – Scenario II UAVs for First Responders – Procurement Forecast Share by Technology by [%] – 2016-2021
Table 61 – Central Asia – Scenario II UAVs for First Responders – O&M Market Forecast by Technology by [$Millions] – 2016-2021
Table 62 – Central Asia – Scenario II UAVs for First Responders – O&M Market Forecast Share by Technology by [%] – 2016-2021
Table 63 – Europe – Scenario II UAVs for First Responders – Market Forecast by Technology by [$Millions] – 2016-2021
Table 64 – Europe – Scenario II UAVs for First Responders – Market Forecast Share by Technology by [%] – 2016-2021
Table 65 – Europe – Scenario II UAVs for First Responders – Procurement Forecast by Technology by [$Millions] – 2016-2021
Table 66 – Europe – Scenario II UAVs for First Responders – Procurement Forecast Share by Technology by [%] – 2016-2021
Table 67 – Europe – Scenario II UAVs for First Responders – O&M Market Forecast by Technology by [$Millions] – 2016-2021
Table 68 – Europe – Scenario II UAVs for First Responders – O&M Market Forecast Share by Technology by [%] – 2016-2021
Table 69 – Near East – Scenario II UAVs for First Responders – Market Forecast by Technology by [$Millions] – 2016-2021
Table 70 – Near East – Scenario II UAVs for First Responders – Market Forecast Share by Technology by [%] – 2016-2021
Table 71 – Near East – Scenario II UAVs for First Responders – Procurement Forecast by Technology by [$Millions] – 2016-2021
Table 72 – Near East – Scenario II UAVs for First Responders – O&M Market Forecast by Technology by [$Millions] – 2016-2021
Table 73 – Near East – Scenario II UAVs for First Responders – O&M Market Forecast Share by Technology by [%] – 2016-2021
Table 74 – North America – Scenario II UAVs for First Responders – Market Forecast by Technology by [$Millions] – 2016-2021
Table 75 – North America – Scenario II UAVs for First Responders – Market Forecast Share by Technology by [%] – 2016-2021
Table 76 – North America – Scenario II UAVs for First Responders – Procurement Forecast by Technology by [$Millions] – 2016-2021
Table 77 – North America – Scenario II UAVs for First Responders – Procurement Forecast Share by Technology by [%] – 2016-2021
Table 78 – North America – Scenario II UAVs for First Responders – O&M Market Forecast by Technology by [$Millions] – 2016-2021
Table 79 – North America – Scenario II UAVs for First Responders – O&M Market Forecast Share by Technology by [%] – 2016-2021
Table 80 – South America – Scenario II UAVs for First Responders – Market Forecast by Technology by [$Millions] – 2016-2021
Table 81 – South America – Scenario II UAVs for First Responders – Market Forecast Share by Technology by [%] – 2016-2021
Table 82 – South America – Scenario II UAVs for First Responders – Procurement Forecast by Technology by [$Millions] – 2016-2021
Table 83 – South America – Scenario II UAVs for First Responders – Procurement Forecast Share by Technology by [%] – 2016-2021
Table 84 – South America – Scenario II UAVs for First Responders – O&M Market Forecast by Technology by [$Millions] – 2016-2021
Table 85 – South America – Scenario II UAVs for First Responders – O&M Market Forecast Share by Technology by [%] – 2016-2021
Table 86 – East Asia and Oceania – Scenario II UAVs for First Responders – Market Forecast by Technology by [$Millions] – 2016-2021
Table 87 – East Asia and Oceania – Scenario II UAVs for First Responders – Market Forecast Share by Technology by [%] – 2016-2021
Table 88 – East Asia and Oceania – Scenario II UAVs for First Responders – Procurement Forecast by Technology by [$Millions] – 2016-2021
Table 89 – East Asia and Oceania – Scenario II UAVs for First Responders – Procurement Forecast Share by Technology by [%] – 2016-2021
Table 90 – East Asia and Oceania – Scenario II UAVs for First Responders – O&M Market Forecast by Technology by [$Millions] – 2016-2021
Table 91 – East Asia and Oceania – Scenario II UAVs for First Responders – O&M Market Forecast Share by Technology by [%] – 2016-2021
Table 92 – Scenario I UAVs for First Responders – Global Market Forecast by Technology by [$Millions] – 2016-2021
Table 93 – Scenario I UAVs for First Responders – Global Market Forecast Share by Technology by [%] – 2016-2021
Table 94 – Scenario I – Micro UAVs for First Responders Market Forecast by Region by [$Millions] – 2016-2021
Table 95 – Scenario I – Micro UAVs for First Responders Market Forecast Share by Region by [%] – 2016-2021
Table 96 – Scenario I – Micro UAVs for First Responders Procurement Forecast by Region by [$Millions] – 2016-2021
Table 97 – Scenario I – Micro UAVs for First Responders Procurement Forecast Share by Region by [%] – 2016-2021
Table 98 – Scenario I – Micro UAVs for First Responders O&M Market Forecast by Region by [$Millions] – 2016-2021
Table 99 – Scenario I – Micro UAVs for First Responders O&M Market Forecast Share by Region by [%] – 2016-2021
Table 100 – Scenario I – Low Altitude UAVs for First Responders Market Forecast by Region by [$Millions] – 2016-2021
Table 101 – Scenario I – Low Altitude UAVs for First Responders Market Forecast Share by Region by [%] – 2016-2021
Table 102 – Scenario I – Low Altitude UAVs for First Responders Procurement Forecast by Region by [$Millions] – 2016-2021
Table 103 – Scenario I – Low Altitude UAVs for First Responders Procurement Forecast Share by Region by [%] – 2016-2021
Table 104 – Scenario I – Low Altitude UAVs for First Responders O&M Market Forecast by Region by [$Millions] – 2016-2021
Table 105 – Scenario I – Low Altitude UAVs for First Responders O&M Market Forecast Share by Region by [%] – 2016-2021
Table 106 – Scenario I – Medium Altitude UAVs for First Responders Market Forecast by Region by [$Millions] – 2016-2021
Table 107 – Scenario I – Medium Altitude UAVs for First Responders Market Forecast Share by Region by [%] – 2016-2021
Table 108 – Scenario I – Medium Altitude UAVs for First Responders Procurement Forecast by Region by [$Millions] – 2016-2021
Table 109 – Scenario I – Medium Altitude UAVs for First Responders Procurement Forecast Share by Region by [%] – 2016-2021
Table 110 – Scenario I – Medium Altitude UAVs for First Responders O&M Market Forecast by Region by [$Millions] – 2016-2021
Table 111 – Scenario I – Medium Altitude UAVs for First Responders O&M Market Forecast Share by Region by [%] – 2016-2021
Table 112 – Scenario I – High Altitude UAVs for First Responders Market Forecast by Region by [$Millions] – 2016-2021
Table 113 – Scenario I – High Altitude UAVs for First Responders Market Forecast Share by Region by [%] – 2016-2021
Table 114 – Scenario I – High Altitude UAVs for First Responders Procurement Forecast by Region by [$Millions] – 2016-2021
Table 115 – Scenario I – High Altitude UAVs for First Responders Procurement Forecast Share by Region by [%] – 2016-2021
Table 116 – Scenario I – High Altitude UAVs for First Responders O&M Market Forecast by Region by [$Millions] – 2016-2021
Table 117 – Scenario I – High Altitude UAVs for First Responders O&M Market Forecast Share by Region by [%] – 2016-2021
Table 118 – Scenario II UAVs for First Responders – Global Market Forecast by Technology by [$Millions] – 2016-2021
Table 119 – Scenario II UAVs for First Responders – Global Market Forecast Share by Technology by [%] – 2016-2021
Table 120 – Scenario II – Micro UAVs for First Responders Market Forecast by Region by [$Millions] – 2016-2021
Table 121 – Scenario II – Micro UAVs for First Responders Market Forecast Share by Region by [%] – 2016-2021
Table 122 – Scenario II – Micro UAVs for First Responders Procurement Forecast by Region by [$Millions] – 2016-2021
Table 123 – Scenario II – Micro UAVs for First Responders Procurement Forecast Share by Region by [%] – 2016-2021
Table 124 – Scenario II – Micro UAVs for First Responders O&M Market Forecast by Region by [$Millions] – 2016-2021
Table 125 – Scenario II – Micro UAVs for First Responders O&M Market Forecast Share by Region by [%] – 2016-2021
Table 126 – Scenario II – Low Altitude UAVs for First Responders Market Forecast by Region by [$Millions] – 2016-2021
Table 127 – Scenario II – Low Altitude UAVs for First Responders Market Forecast Share by Region by [%] – 2016-2021
Table 128 – Scenario II – Low Altitude UAVs for First Responders Procurement Forecast by Region by [$Millions] – 2016-2021
Table 129 – Scenario II – Low Altitude UAVs for First Responders Procurement Forecast Share by Region by [%] – 2016-2021
Table 130 – Scenario II – Low Altitude UAVs for First Responders O&M Market Forecast by Region by [$Millions] – 2016-2021
Table 131 – Scenario II – Low Altitude UAVs for First Responders O&M Market Forecast Share by Region by [%] – 2016-2021
Table 132 – Scenario II – Medium Altitude UAVs for First Responders Market Forecast by Region by [$Millions] – 2016-2021
Table 133 – Scenario II – Medium Altitude UAVs for First Responders Market Forecast Share by Region by [%] – 2016-2021
Table 134 – Scenario II – Medium Altitude UAVs for First Responders Procurement Forecast by Region by [$Millions] – 2016-2021
Table 135 – Scenario II – Medium Altitude UAVs for First Responders Procurement Forecast Share by Region by [%] – 2016-2021
Table 136 – Scenario II – Medium Altitude UAVs for First Responders O&M Market Forecast by Region by [$Millions] – 2016-2021
Table 137 – Scenario II – Medium Altitude UAVs for First Responders O&M Market Forecast Share by Region by [%] – 2016-2021
Table 138 – Scenario II – High Altitude UAVs for First Responders Market Forecast by Region by [$Millions] – 2016-2021
Table 139 – Scenario II – High Altitude UAVs for First Responders Market Forecast Share by Region by [%] – 2016-2021
Table 140 – Scenario II – High Altitude UAVs for First Responders Procurement Forecast by Region by [$Millions] – 2016-2021
Table 141 – Scenario II – High Altitude UAVs for First Responders Procurement Forecast Share by Region by [%] – 2016-2021
Table 142 – Scenario II – High Altitude UAVs for First Responders O&M Market Forecast by Region by [$Millions] – 2016-2021
Table 143 – Scenario II – High Altitude UAVs for First Responders O&M Market Forecast Share by Region by [%] – 2016-2021
Table 144 – Scenario I UAVs for First Responders – Global Procurement Forecast by Technology by [$Millions] – 2016-2021
Table 145 – Scenario I UAVs for First Responders – Global Procurement Forecast Share by Technology by [%] – 2016-2021
Table 146 – Scenario II UAVs for First Responders – Global Procurement Forecast by Technology by [$Millions] – 2016-2021
Table 147 – Scenario II UAVs for First Responders – Global Procurement Forecast Share by Technology by [%] – 2016-2021
Table 148 – Scenario I – UAVs for First Responders Procurement Forecast by Region by [$Millions] – 2016-2021
Table 149 – Scenario I – UAVs for First Responders Procurement Forecast Share by Region by [%] – 2016-2021
Table 150 – Scenario II – UAVs for First Responders Procurement Forecast by Region by [$Millions] – 2016-2021
Table 151 – Scenario II – UAVs for First Responders Procurement Forecast Share by Region by [%] – 2016-2021
Table 152 – Scenario I UAVs for First Responders – Global O&M Market Forecast by Technology by [$Millions] – 2016-2021
Table 153 – Scenario I UAVs for First Responders – Global O&M Market Forecast Share by Technology by [%] – 2016-2021
Table 154 – Scenario II UAVs for First Responders – Global O&M Market Forecast by Technology by [$Millions] – 2016-2021
Table 155 – Scenario II UAVs for First Responders – Global O&M Market Forecast Share by Technology by [%] – 2016-2021
Table 156 – Scenario I – UAVs for First Responders O&M Market Forecast by Region by [$Millions] – 2016-2021
Table 157 – Scenario I – UAVs for First Responders O&M Market Forecast Share by Region by [%] – 2016-2021
Table 158 – Scenario II – UAVs for First Responders O&M Market Forecast by Region by [$Millions] – 2016-2021
Table 159 – Scenario II – UAVs for First Responders O&M Market Forecast Share by Region by [%] – 2016-2021
Table 160 – UAVs for First Responders – Scenario I vs. Scenario II Global Market Forecast Comparison by [$Millions] – 2016-2021
Table 161 – Micro UAVs for First Responders – Scenario I vs. Scenario II Market Forecast Comparison by [$Millions] – 2016-2021
Table 162 – Low Altitude UAVs for First Responders – Scenario I vs. Scenario II Market Forecast Comparison by [$Millions] – 2016-2021
Table 163 – Medium Altitude UAVs for First Responders – Scenario I vs. Scenario II Market Forecast Comparison by [$Millions] – 2016-2021
Table 164 – High Altitude UAVs for First Responders – Scenario I vs. Scenario II Market Forecast Comparison by [$Millions] – 2016-2021
Table 165 – UAVs for First Responders – Scenario I vs. Scenario II Procurement Forecast Comparison by [$Millions] – 2016-2021
Table 166 – Micro UAVs for First Responders – Scenario I vs. Scenario II Procurement Forecast Comparison by [$Millions] – 2016-2021
Table 167 – Low Altitude UAVs for First Responders – Scenario I vs. Scenario II Procurement Forecast Comparison by [$Millions] – 2016-2021
Table 168 – Medium Altitude UAVs for First Responders – Scenario I vs. Scenario II Procurement Forecast Comparison by [$Millions] – 2016-2021
Table 169 – High Altitude UAVs for First Responders – Scenario I vs. Scenario II Procurement Forecast Comparison by [$Millions] – 2016-2021
Table 170 – UAVs for First Responders – Scenario I vs. Scenario II O&M Market Forecast Comparison by [$Millions] – 2016-2021
Table 171 – Micro UAVs for First Responders – Scenario I vs. Scenario II O&M Market Forecast Comparison by [$Millions] – 2016-2021
Table 172 – Low Altitude UAVs for First Responders – Scenario I vs. Scenario II O&M Market Forecast Comparison by [$Millions] – 2016-2021
Table 173 – Medium Altitude UAVs for First Responders – Scenario I vs. Scenario II O&M Market Forecast Comparison by [$Millions] – 2016-2021
Table 174 – High Altitude UAVs for First Responders – Scenario I vs. Scenario II O&M Market Forecast Comparison by [$Millions] – 2016-2021
Table 175 – Africa – UAVs for First Responders – Scenario I vs. Scenario II Market Forecast Comparison by [$Millions] – 2016-2021
Table 176 – Central Asia – UAVs for First Responders – Scenario I vs. Scenario II Market Forecast Comparison by [$Millions] – 2016-2021
Table 177 – Europe – UAVs for First Responders – Scenario I vs. Scenario II Market Forecast Comparison by [$Millions] – 2016-2021
Table 178 – Near East – UAVs for First Responders – Scenario I vs. Scenario II Market Forecast Comparison by [$Millions] – 2016-2021
Table 179 – North America – UAVs for First Responders – Scenario I vs. Scenario II Market Forecast Comparison by [$Millions] – 2016-2021
Table 180 – South America – UAVs for First Responders – Scenario I vs. Scenario II Market Forecast Comparison by [$Millions] – 2016-2021
Table 181 – East Asia & Oceania – UAVs for First Responders – Scenario I vs. Scenario II Market Forecast Comparison by [$Millions] – 2016-2021
List of Figures
Figure 1 – US States Restricting UAVs for Law Enforcement
Figure 2 – American States Competing to Test UAVs
Figure 3 – Impacted Clutha Pub
Figure 4 – SkySentry Aerostat System
Figure 5 – GimBall Micro UAV
Figure 6 – Scenario I – UAVs for First Responders Market Forecast by Region by [$Millions] – 2016-2021
Figure 7 – Scenario II – UAVs for First Responders Market Forecast by Region by [$Millions] – 2016-2021
Figure 8 – Scenario I UAVs for First Responders – Global Market Forecast by Technology by [$Millions] – 2016-2021
Figure 9 – Scenario II UAVs for First Responders – Global Market Forecast by Technology by [$Millions] – 2016-2021
Figure 10 – Scenario I UAVs for First Responders – Global Procurement Forecast by Technology by [$Millions] – 2016-2021
Figure 11 – Scenario II UAVs for First Responders – Global Procurement Forecast by Technology by [$Millions] – 2016-2021
Figure 12 – Scenario I UAVs for First Responders – Global O&M Market Forecast by Technology by [$Millions] – 2016-2021
Figure 13 – Scenario II UAVs for First Responders – Global O&M Market Forecast by Technology by [$Millions] – 2016-2021
Figure 14 – UAVs for First Responders – Scenario I vs. Scenario II Global Market Forecast Comparison by [$Millions] – 2016-2021
Figure 15 – UAV Manufacturing Nations – by Capability
Figure 16 – Titan Aerospace Solara UAV
Figure 17 – Stratospheric UAV Airship Design
Figure 18 – Global Observer: Stratospheric UAV Design
Figure 19 – Heron TP: Jet Stream UAV
Figure 20 – Anka: High Altitude UAV
Figure 21 – Shadow: Medium Altitude UAV
Figure 22 – Uqab II: Low Altitude UAV
Figure 23: Aerial Electric Visual Assistant (AEVATM)
Figure 24 – Model A-10 Fire Firefighting Aircraft
Figure 25 – German Soldier Hand Launching a Micro UAV
Figure 26 – Mesa County, Colorado, USA Draganflyer X6
Figure 27 – Black Hornet Nano UAV
Figure 28 – Nighthawk IV
Figure 29 – Conventional Large Aerostat Design
Figure 30 – Improved Large Aerostat Design
Figure 31 – Aerostat Designed For Low Wind Drag
Figure 32 – XFC: Micro UAV
Figure 33 – El Paso County, Colorado, USA
Figure 34 – Political Response Time Priorities
Figure 35 – Three and Ten Minute Response Coverage, No Wind
Figure 36 – Typical Operation, Overhead View
Figure 37 – Typical Operation, Side View
Figure 38 – Aerovironment Qubes Police Micro UAV
Figure 39 – D-Dalus Cyclodial Propulsor UAV
Figure 40 – Scenario I – UAVs for First Responders Market Forecast by Region by [$Millions] – 2016-2021
Figure 41 – Scenario I – UAVs for First Responders Market Behavior by Region by [%] – 2016-2021
Figure 42 – Africa – Scenario I UAVs for First Responders – Market Forecast by Technology by [$Millions] – 2016-2021
Figure 43 – Africa – Scenario I UAVs for First Responders – Market Behavior by Technology by [%] – 2016-2021
Figure 44 – Africa – Scenario I UAVs for First Responders – Procurement Forecast by Technology by [$Millions] – 2016-2021
Figure 45 – Africa – Scenario I UAVs for First Responders – Procurement Behavior by Technology by [%] – 2016-2021
Figure 46 – Africa – Scenario I UAVs for First Responders – O&M Market Forecast by Technology by [$Millions] – 2016-2021
Figure 47 – Africa – Scenario I UAVs for First Responders – O&M Market Behavior by Technology by [%] – 2016-2021
Figure 48 – Central Asia – Scenario I UAVs for First Responders – Market Forecast by Technology by [$Millions] – 2016-2021
Figure 49 – Central Asia – Scenario I UAVs for First Responders – Market Behavior by Technology by [%] – 2016-2021
Figure 50 – Central Asia – Scenario I UAVs for First Responders – Procurement Forecast by Technology by [$Millions] – 2016-2021
Figure 51 – Central Asia – Scenario I UAVs for First Responders – Procurement Behavior by Technology by [%] – 2016-2021
Figure 52 – Central Asia – Scenario I UAVs for First Responders – O&M Market Forecast by Technology by [$Millions] – 2016-2021
Figure 53 – Central Asia – Scenario I UAVs for First Responders – O&M Market Behavior by Technology by [%] – 2016-2021
Figure 54 – Europe – Scenario I UAVs for First Responders – Market Forecast by Technology by [$Millions] – 2016-2021
Figure 55 – Europe – Scenario I UAVs for First Responders – Market Behavior by Technology by [%] – 2016-2021
Figure 56 – Europe – Scenario I UAVs for First Responders – Procurement Forecast by Technology by [$Millions] – 2016-2021
Figure 57 – Europe – Scenario I UAVs for First Responders – O&M Market Forecast by Technology by [$Millions] – 2016-2021
Figure 58 – Europe – Scenario I UAVs for First Responders – O&M Market Behavior by Technology by [%] – 2016-2021
Figure 59 – Near East – Scenario I UAVs for First Responders – Market Forecast by Technology by [$Millions] – 2016-2021
Figure 60 – Near East – Scenario I UAVs for First Responders – Procurement Forecast by Technology by [$Millions] – 2016-2021
Figure 61 – Near East – Scenario I UAVs for First Responders – O&M Market Forecast by Technology by [$Millions] – 2016-2021
Figure 62 – North America – Scenario I UAVs for First Responders – Market Forecast by Market Segments by [$Millions] – 2016-2021
Figure 63 – North America – Scenario I UAVs for First Responders – Market Behavior by Market Segments by [%] – 2016-2021
Figure 64 – South America – Scenario I UAVs for First Responders – Market Forecast by Technology by [$Millions] – 2016-2021
Figure 65 – South America – Scenario I UAVs for First Responders – Market Behavior by Technology by [%] – 2016-2021
Figure 66 – South America – Scenario I UAVs for First Responders – Procurement Forecast by Technology by [$Millions] – 2016-2021
Figure 67 – South America – Scenario I UAVs for First Responders – Procurement Behavior by Technology by [%] – 2016-2021
Figure 68 – South America – Scenario I UAVs for First Responders – O&M Market Forecast by Technology by [$Millions] – 2016-2021
Figure 69 – South America – Scenario I UAVs for First Responders – O&M Market Behavior by Technology by [%] – 2016-2021
Figure 70 – East Asia and Oceania – Scenario I UAVs for First Responders – Market Forecast by Technology by [$Millions] – 2016-2021
Figure 71 – East Asia and Oceania – Scenario I UAVs for First Responders – Market Behavior by Technology by [%] – 2016-2021
Figure 72 – East Asia and Oceania – Scenario I UAVs for First Responders – Procurement Forecast by Technology by [$Millions] – 2016-2021
Figure 73 – East Asia and Oceania – Scenario I UAVs for First Responders – Procurement Behavior by Technology by [%] – 2016-2021
Figure 74 – East Asia and Oceania – Scenario I UAVs for First Responders – O&M Market Forecast by Technology by [$Millions] – 2016-2021
Figure 75 – East Asia and Oceania – Scenario I UAVs for First Responders – O&M Market Behavior by Technology by [%] – 2016-2021
Figure 76 – Scenario II – UAVs for First Responders Market Forecast by Region by [$Millions] – 2016-2021
Figure 77 – Scenario II – UAVs for First Responders Market Behavior by Region by [%] – 2016-2021
Figure 78 – Africa – Scenario II UAVs for First Responders – Market Forecast by Technology by [$Millions] – 2016-2021
Figure 79 – Africa – Scenario II UAVs for First Responders – Market Behavior by Technology by [%] – 2016-2021
Figure 80 – Africa – Scenario II UAVs for First Responders – Procurement Forecast by Technology by [$Millions] – 2016-2021
Figure 81 – Africa – Scenario II UAVs for First Responders – Procurement Behavior by Technology by [%] – 2016-2021
Figure 82 – Africa – Scenario II UAVs for First Responders – O&M Market Forecast by Technology by [$Millions] – 2016-2021
Figure 83 – Africa – Scenario II UAVs for First Responders – O&M Market Behavior by Technology by [%] – 2016-2021
Figure 84 – Central Asia – Scenario II UAVs for First Responders – Market Forecast by Technology by [$Millions] – 2016-2021
Figure 85 – Central Asia – Scenario II UAVs for First Responders – Market Behavior by Technology by [%] – 2016-2021
Figure 86 – Central Asia – Scenario II UAVs for First Responders – Procurement Forecast by Technology by [$Millions] – 2016-2021
Figure 87 – Central Asia – Scenario II UAVs for First Responders – Procurement Behavior by Technology by [%] – 2016-2021
Figure 88 – Central Asia – Scenario II UAVs for First Responders – O&M Market Forecast by Technology by [$Millions] – 2016-2021
Figure 89 – Central Asia – Scenario II UAVs for First Responders – O&M Market Behavior by Technology by [%] – 2016-2021
Figure 90 – Europe – Scenario II UAVs for First Responders – Market Forecast by Technology by [$Millions] – 2016-2021
Figure 91 – Europe – Scenario II UAVs for First Responders – Market Behavior by Technology by [%] – 2016-2021
Figure 92 – Europe – Scenario II UAVs for First Responders – Procurement Forecast by Technology by [$Millions] – 2016-2021
Figure 93 – Europe – Scenario II UAVs for First Responders – Procurement Behavior by Technology by [%] – 2016-2021
Figure 94 – Europe – Scenario II UAVs for First Responders – O&M Market Forecast by Technology by [$Millions] – 2016-2021
Figure 95 – Europe – Scenario II UAVs for First Responders – O&M Market Behavior by Technology by [%] – 2016-2021
Figure 96 – Near East – Scenario II UAVs for First Responders – Market Forecast by Technology by [$Millions] – 2016-2021
Figure 97 – Near East – Scenario II UAVs for First Responders – Procurement Forecast by Technology by [$Millions] – 2016-2021
Figure 98 – Near East – Scenario II UAVs for First Responders – O&M Market Forecast by Technology by [$Millions] – 2016-2021
Figure 99 – North America – Scenario II UAVs for First Responders – Market Forecast by Technology by [$Millions] – 2016-2021
Figure 100 – North America – Scenario II UAVs for First Responders – Market Behavior by Technology by [%] – 2016-2021
Figure 101 – North America – Scenario II UAVs for First Responders – Procurement Forecast by Technology by [$Millions] – 2016-2021
Figure 102 – North America – Scenario II UAVs for First Responders – Procurement Behavior by Technology by [%] – 2016-2021
Figure 103 – North America – Scenario II UAVs for First Responders – O&M Market Forecast by Technology by [$Millions] – 2016-2021
Figure 104 – North America – Scenario II UAVs for First Responders – O&M Market Behavior by Technology by [%] – 2016-2021
Figure 105 – South America – Scenario II UAVs for First Responders – Market Forecast by Technology by [$Millions] – 2016-2021
Figure 106 – South America – Scenario II UAVs for First Responders – Market Behavior by Technology by [%] – 2016-2021
Figure 107 – South America – Scenario II UAVs for First Responders – Procurement Forecast by Technology by [$Millions] – 2016-2021
Figure 108 – South America – Scenario II UAVs for First Responders – Procurement Behavior by Technology by [%] – 2016-2021
Figure 109 – South America – Scenario II UAVs for First Responders – O&M Market Forecast by Technology by [$Millions] – 2016-2021
Figure 110 – South America – Scenario II UAVs for First Responders – O&M Market Behavior by Technology by [%] – 2016-2021
Figure 111 – East Asia and Oceania – Scenario II UAVs for First Responders – Market Forecast by Technology by [$Millions] – 2016-2021
Figure 112 – East Asia and Oceania – Scenario II UA/-Vs for First Responders – Market Behavior by Technology by [%] – 2016-2021
Figure 113 – East Asia and Oceania – Scenario II UAVs for First Responders – Procurement Forecast by Technology by [$Millions] – 2016-2021
Figure 114 – East Asia and Oceania – Scenario II UAVs for First Responders – Procurement Behavior by Technology by [%] – 2016-2021
Figure 115 – East Asia and Oceania – Scenario II UAVs for First Responders – O&M Market Forecast by Technology by [$Millions] – 2016-2021
Figure 116 – East Asia and Oceania – Scenario II UAVs for First Responders – O&M Market Behavior by Technology by [%] – 2016-2021
Figure 117 – Scenario I UAVs for First Responders – Global Market Forecast by Technology by [$Millions] – 2016-2021
Figure 118 – Scenario I UAVs for First Responders – Global Market Behavior by Technology by [%] – 2016-2021
Figure 119 – Scenario I – Micro UAVs for First Responders Market Forecast by Region by [$Millions] – 2016-2021
Figure 120 – Scenario I – Micro UAVs for First Responders Market Behavior by Region by [%] – 2016-2021
Figure 121 – Scenario I – Micro UAVs for First Responders Procurement Forecast by Region by [$Millions] – 2016-2021
Figure 122 – Scenario I – Micro UAVs for First Responders Procurement Behavior by Region by [%] – 2016-2021
Figure 123 – Scenario I – Micro UAVs for First Responders O&M Market Forecast by Region by [$Millions] – 2016-2021
Figure 124 – Scenario I – Micro UAVs for First Responders O&M Market Behavior by Region by [%] – 2016-2021
Figure 125 – Scenario I – Low Altitude UAVs for First Responders Market Forecast by Region by [$Millions] – 2016-2021
Figure 126 – Scenario I – Low Altitude UAVs for First Responders Market Behavior by Region by [%] – 2016-2021
Figure 127 – Scenario I – Low Altitude UAVs for First Responders Procurement Forecast by Region by [$Millions] – 2016-2021
Figure 128 – Scenario I – Low Altitude UAVs for First Responders Procurement Behavior by Region by [%] – 2016-2021
Figure 129 – Scenario I – Low Altitude UAVs for First Responders O&M Market Forecast by Region by [$Millions] – 2016-2021
Figure 130 – Scenario I – Low Altitude UAVs for First Responders O&M Market Behavior by Region by [%] – 2016-2021
Figure 131 – Scenario I – Medium Altitude UAVs for First Responders Market Forecast by Region by [$Millions] – 2016-2021
Figure 132 – Scenario I – Medium Altitude UAVs for First Responders Market Behavior by Region by [%] – 2016-2021
Figure 133 – Scenario I – Medium Altitude UAVs for First Responders Procurement Forecast by Region by [$Millions] – 2016-2021
Figure 134 – Scenario I – Medium Altitude UAVs for First Responders Procurement Behavior by Region by [%] – 2016-2021
Figure 135 – Scenario I – Medium Altitude UAVs for First Responders O&M Market Forecast by Region by [$Millions] – 2016-2021
Figure 136 – Scenario I – Medium Altitude UAVs for First Responders O&M Market Behavior by Region by [%] – 2016-2021
Figure 137 – Scenario I – High Altitude UAVs for First Responders Market Forecast by Region by [$Millions] – 2016-2021
Figure 138 – Scenario I – High Altitude UAVs for First Responders Market Behavior by Region by [%] – 2016-2021
Figure 139 – Scenario I – High Altitude UAVs for First Responders Procurement Forecast by Region by [$Millions] – 2016-2021
Figure 140 – Scenario I – High Altitude UAVs for First Responders Procurement Behavior by Region by [%] – 2016-2021
Figure 141 – Scenario I – High Altitude UAVs for First Responders O&M Market Forecast by Region by [$Millions] – 2016-2021
Figure 142 – Scenario I – High Altitude UAVs for First Responders O&M Market Behavior by Region by [%] – 2016-2021
Figure 143 – Scenario II UAVs for First Responders – Global Market Forecast by Technology by [$Millions] – 2016-2021
Figure 144 – Scenario II UAVs for First Responders – Global Market Behavior by Technology by [%] – 2016-2021
Figure 145 – Scenario II – Micro UAVs for First Responders Market Forecast by Region by [$Millions] – 2016-2021
Figure 146 – Scenario II – Micro UAVs for First Responders Market Behavior by Region by [%] – 2016-2021
Figure 147 – Scenario II – Micro UAVs for First Responders Procurement Forecast by Region by [$Millions] – 2016-2021
Figure 148 – Scenario II – Micro UAVs for First Responders Procurement Behavior by Region by [%] – 2016-2021
Figure 149 – Scenario II – Micro UAVs for First Responders O&M Market Forecast by Region by [$Millions] – 2016-2021
Figure 150 – Scenario II – Micro UAVs for First Responders O&M Market Behavior by Region by [%] – 2016-2021
Figure 151 – Scenario II – Low Altitude UAVs for First Responders Market Forecast by Region by [$Millions] – 2016-2021
Figure 152 – Scenario II – Low Altitude UAVs for First Responders Market Behavior by Region by [%] – 2016-2021
Figure 153 – Scenario II – Low Altitude UAVs for First Responders Procurement Forecast by Region by [$Millions] – 2016-2021
Figure 154 – Scenario II – Low Altitude UAVs for First Responders Procurement Behavior by Region by [%] – 2016-2021
Figure 155 – Scenario II – Low Altitude UAVs for First Responders O&M Market Forecast by Region by [$Millions] – 2016-2021
Figure 156 – Scenario II – Low Altitude UAVs for First Responders O&M Market Behavior by Region by [%] – 2016-2021
Figure 157 – Scenario II – Medium Altitude UAVs for First Responders Market Forecast by Region by [$Millions] – 2016-2021
Figure 158 – Scenario II – Medium Altitude UAVs for First Responders Market Behavior by Region by [%] – 2016-2021
Figure 159 – Scenario II – Medium Altitude UAVs for First Responders Procurement Forecast by Region by [$Millions] – 2016-2021
Figure 160 – Scenario II – Medium Altitude UAVs for First Responders Procurement Behavior by Region by [%] – 2016-2021
Figure 161 – Scenario II – Medium Altitude UAVs for First Responders O&M Market Forecast by Region by [$Millions] – 2016-2021
Figure 162 – Scenario II – Medium Altitude UAVs for First Responders O&M Market Behavior by Region by [%] – 2016-2021
Figure 163 – Scenario II – High Altitude UAVs for First Responders Market Forecast by Region by [$Millions] – 2016-2021
Figure 164 – Scenario II – High Altitude UAVs for First Responders Market Behavior by Region by [%] – 2016-2021
Figure 165 – Scenario II – High Altitude UAVs for First Responders Procurement Forecast by Region by [$Millions] – 2016-2021
Figure 166 – Scenario II – High Altitude UAVs for First Responders Procurement Behavior by Region by [%] – 2016-2021
Figure 167 – Scenario II – High Altitude UAVs for First Responders O&M Market Forecast by Region by [$Millions] – 2016-2021
Figure 168 – Scenario II – High Altitude UAVs for First Responders O&M Market Behavior by Region by [%] – 2016-2021
Figure 169 – Scenario I UAVs for First Responders – Global Procurement Forecast by Technology by [$Millions] – 2016-2021
Figure 170 – Scenario I UAVs for First Responders – Global Procurement Behavior by Technology by [%] – 2016-2021
Figure 171 – Scenario II UAVs for First Responders – Global Procurement Forecast by Technology by [$Millions] – 2016-2021
Figure 172 – Scenario II UAVs for First Responders – Global Procurement Behavior by Technology by [%] – 2016-2021
Figure 173 – Scenario I – UAVs for First Responders Procurement Forecast by Region by [$Millions] – 2016-2021
Figure 174 – Scenario I – UAVs for First Responders Procurement Behavior by Region by [%] – 2016-2021
Figure 175 – Scenario II – UAVs for First Responders Procurement Forecast by Region by [$Millions] – 2016-2021
Figure 176 – Scenario II – UAVs for First Responders Procurement Behavior by Region by [%] – 2016-2021
Figure 177 – Scenario I UAVs for First Responders – Global O&M Market Forecast by Technology by [$Millions] – 2016-2021
Figure 178 – Scenario I UAVs for First Responders – Global O&M Market Behavior by Technology by [%] – 2016-2021
Figure 179 – Scenario II UAVs for First Responders – Global O&M Market Forecast by Technology by [$Millions] – 2016-2021
Figure 180 – Scenario II UAVs for First Responders – Global O&M Market Behavior by Technology by [%] – 2016-2021
Figure 181 – Scenario I – UAVs for First Responders O&M Market Forecast by Region by [$Millions] – 2016-2021
Figure 182 – Scenario I – UAVs for First Responders O&M Market Behavior by Region by [%] – 2016-2021
Figure 183 – Scenario II – UAVs for First Responders O&M Market Forecast by Region by [$Millions] – 2016-2021
Figure 184 – Scenario II – UAVs for First Responders O&M Market Behavior by Region by [%] – 2016-2021
Figure 185 – UAVs for First Responders – Scenario I vs. Scenario II Global Market Forecast Comparison by [$Millions] – 2016-2021
Figure 186 – Micro UAVs for First Responders – Scenario I vs. Scenario II Market Forecast Comparison by [$Millions] – 2016-2021
Figure 187 – Low Altitude UAVs for First Responders – Scenario I vs. Scenario II Market Forecast Comparison by [$Millions] – 2016-2021
Figure 188 – Medium Altitude UAVs for First Responders – Scenario I vs. Scenario II Market Forecast Comparison by [$Millions] – 2016-2021
Figure 189 – High Altitude UAVs for First Responders – Scenario I vs. Scenario II Market Forecast Comparison by [$Millions] – 2016-2021
Figure 190 – UAVs for First Responders – Scenario I vs. Scenario II Procurement Forecast Comparison by [$Millions] – 2016-2021
Figure 191 – Micro UAVs for First Responders – Scenario I vs. Scenario II Procurement Forecast Comparison by [$Millions] – 2016-2021
Figure 192 – Low Altitude UAVs for First Responders – Scenario I vs. Scenario II Procurement Forecast Comparison by [$Millions] – 2016-2021
Figure 193 – Medium Altitude UAVs for First Responders – Scenario I vs. Scenario II Procurement Forecast Comparison by [$Millions] – 2016-2021
Figure 194 – High Altitude UAVs for First Responders – Scenario I vs. Scenario II Procurement Forecast Comparison by [$Millions] – 2016-2021
Figure 195 – UAVs for First Responders – Scenario I vs. Scenario II O&M Market Forecast Comparison by [$Millions] – 2016-2021
Figure 196 – Micro UAVs for First Responders – Scenario I vs. Scenario II O&M Market Forecast Comparison by [$Millions] – 2016-2021
Figure 197 – Low Altitude UAVs for First Responders – Scenario I vs. Scenario II O&M Market Forecast Comparison by [$Millions] – 2016-2021
Figure 198 – Medium Altitude UAVs for First Responders – Scenario I vs. Scenario II O&M Market Forecast Comparison by [$Millions] – 2016-2021
Figure 199 – High Altitude UAVs for First Responders – Scenario I vs. Scenario II O&M Market Forecast Comparison by [$Millions] – 2016-2021
Figure 200 – Africa – UAVs for First Responders – Scenario I vs. Scenario II Market Forecast Comparison by [$Millions] – 2016-2021
Figure 201 – Central Asia – UAVs for First Responders – Scenario I vs. Scenario II Market Forecast Comparison by [$Millions] – 2016-2021
Figure 202 – Near East – UAVs for First Responders – Scenario I vs. Scenario II Market Forecast Comparison by [$Millions] – 2016-2021
Figure 203 – South America – UAVs for First Responders – Scenario I vs. Scenario II Market Forecast Comparison by [$Millions] – 2016-2021
Figure 204 – East Asia & Oceania – UAVs for First Responders – Scenario I vs. Scenario II Market Forecast Comparison by [$Millions] – 2016-2021
Figure 205 – Model Radio Controlled Helicopter for Police
Single User License: This license allows for use of a report by one person. This person may use the report on any computer, and may print out the report, but may not share the report (or any information contained therein) with any other person or persons. Unless a Departmental License, a Site License or a Global Site License is purchased, a Single User License must be purchased for every person that wishes to use the report within the same enterprise. Customers who infringe these license terms are liable for a Global Site license fee.
5-User License: This license allows for use of a report by five people within the same enterprise. Each of these people may use the report on any computer, and may print out the report, but may not share the report (or any information contained therein) with any other person or persons. Customers who infringe these license terms are liable for a Global Site license fee.
Site License: This license allows for use of a report by an unlimited number of people within the same enterprise location. Each of these people may use the report on any computer, and may print out the report, but may not share the report (or any information contained therein) with any person or persons outside of the enterprise location. Customers who infringe these license terms are liable for a Global Site license fee.
Global Site License: This license allows for use of a report by an unlimited number of people within the same enterprise worldwide. Each of these people may use the report on any computer, and may print out the report, but may not share the report (or any information contained therein) with any other person or persons outside of the enterprise.
| Study Code: | MF160068 |
| Publication date: | November 1, 2016 |
| Pages: | 441 |